Modernism Lives Beyond Palm Springs

Detail 2 MCM Blocks

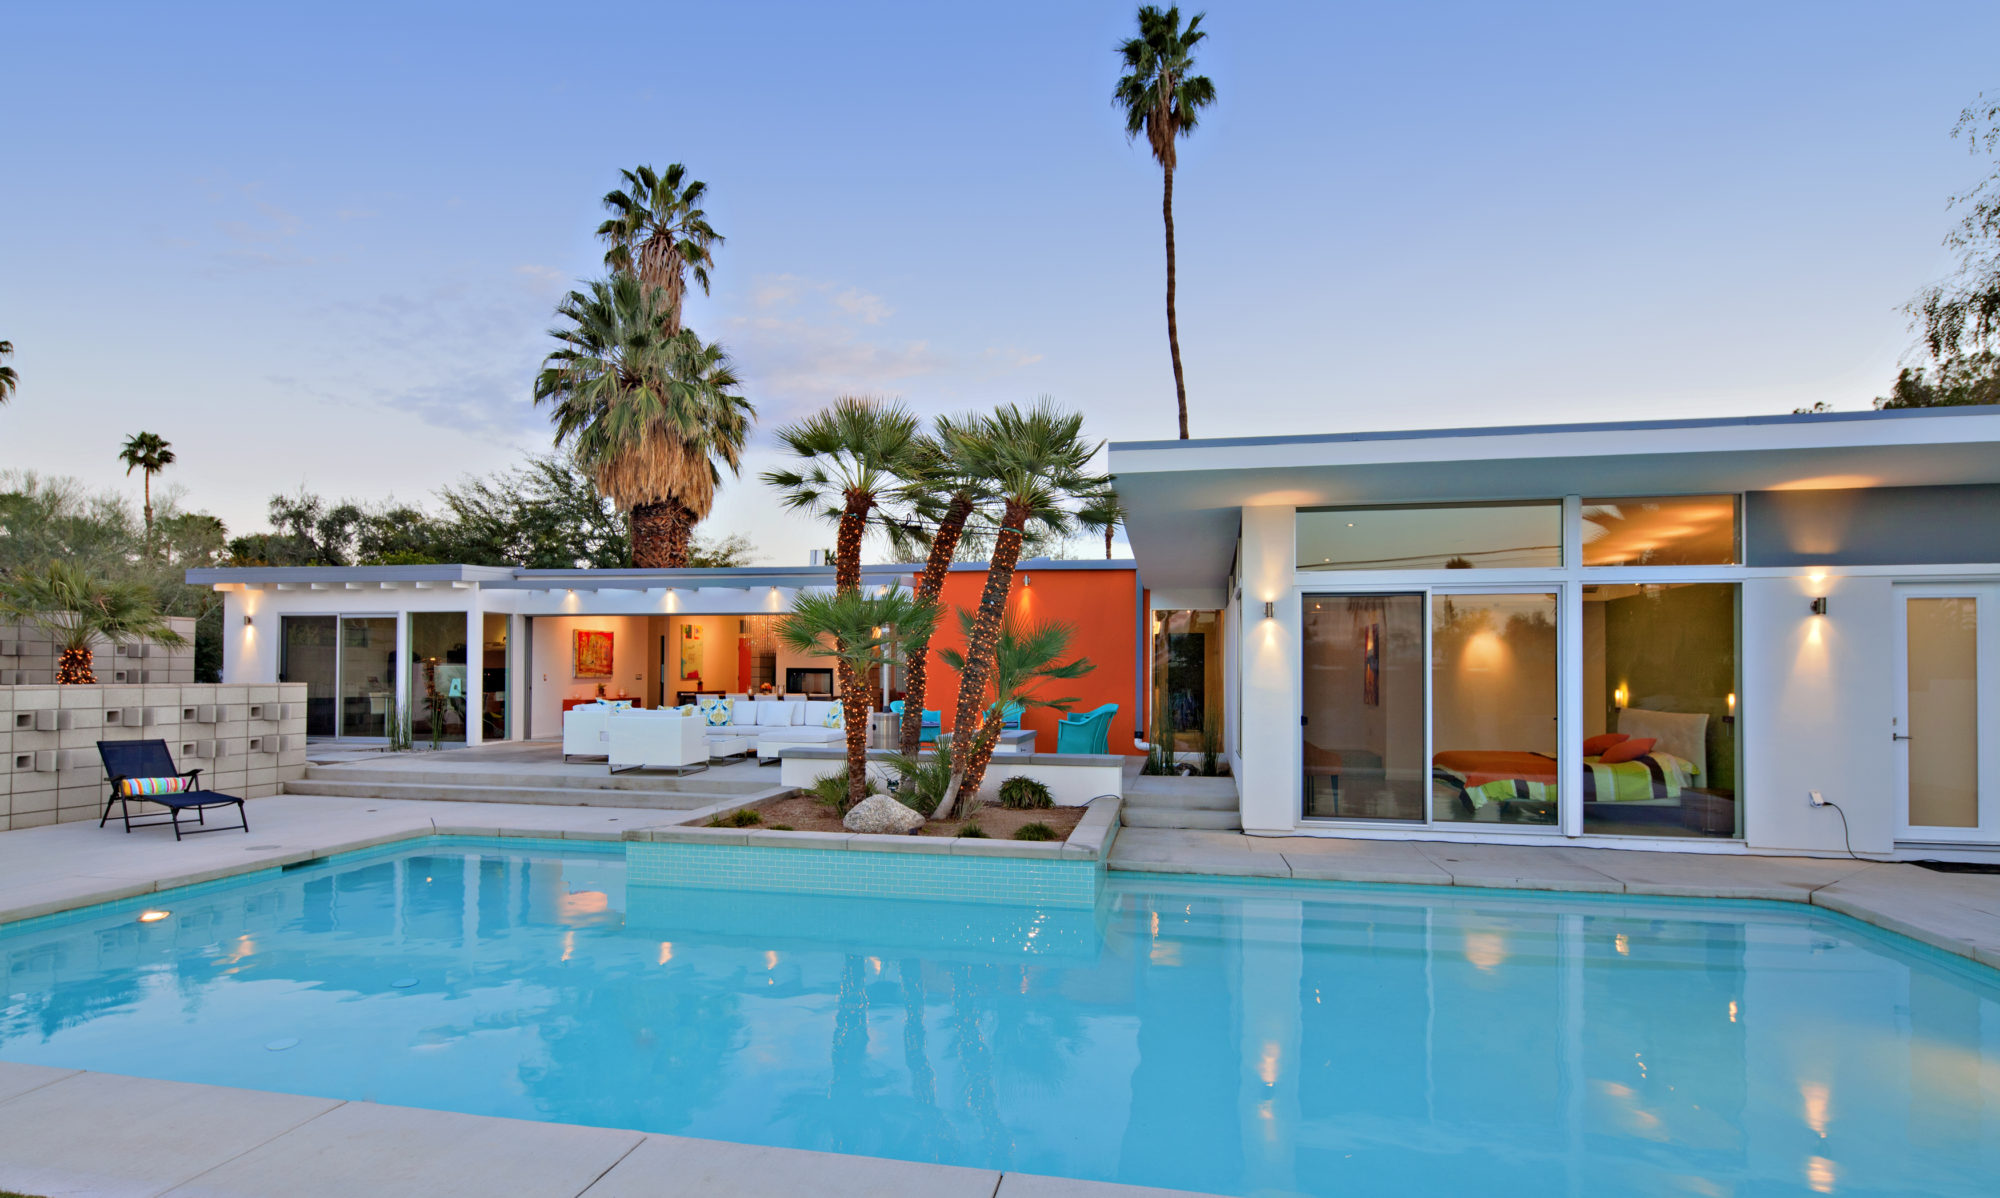
The 40,000-odd visitors to Modernism Week 2014 were made well aware of the Mid-Century Modern homes in Palm Springs, but they may not be aware of the trove available in other parts of the Valley.  At the same time the modernist architects like William Cody, Albert Frey, Krisel and Donald Wexler, to name a few, designed homes in Palm Springs, they did too in Rancho Mirage, Palm Desert, Indian Wells, La Quinta and Indio.

It is very difficult to find exact numbers, but we do have some historical sales data.  Based on the Desert Area Multiple Listing Service, there have been about 7,200 residential sales since 1998 in Palm Springs of mid-century (approximately 1949-1969) homes.  Not all of these are Mid-Century Modern, but some good portion are.

According to the same criteria we should find MCM in good numbers In the five cities mentioned above, where there were about 11,000 Mid-Century sales, more than in Palm Springs.   The average sales price over the period 1998-2014 was about $388,000 in Palm Springs, $435,000 in Rancho Mirage and $424,000 in Indian Wells. Continue reading “Modernism Lives Beyond Palm Springs”

Have Home Prices Hit Bottom?

We can’t really know, but there may be a reason that if they go lower, they won’t stay there. The long-term inflation rate of U.S. housing is around 2.5%. Let’s look at the Case-Shiller Home Price Index for some high-tier markets. The graph below has the Index for three western U.S. cities, with an added line that shows the normal long term rate of housing price inflation of about 2.5%.

Long Term Apprecaion vs Case-Shiller

This long term “normal” growth rate shows that home prices should be about 30% higher now than in 2000. Prices in Vegas and Phoenix have dropped below this long term value, and there should be upward pressure based on this historical trend. Higher than average inflation is expected and will further increase this upward pressure.

L.A. may be a bit different, as it may have been still feeling the effects of the 1990’s California bubble and recession when the Index base of year 2000 was established. If so, this might have raised the base home values in 2000, made the peak lower and therefore today’s index lower, closer to Phoenix and L.A. If this is not the case, L.A. may still be above the normal inflation value, and vulnerable to further declines.

In the Palm Springs area, homes that have devalued from about 35 to 50% may have hit bottom, at least in the long view of things. They may stay there until economic and employment conditions improve.

Wayne Longman

High-End Home Sales

We don’t have a Case-Shiller Home Price Index for our area, so we make do with what we have.  We can’t simply track prices say above $1 Million, because that is a changing population – a house that sold for $1.5 M a couple of years ago may have sold recently for $950,000, and we would lose that change based on a price limit alone.  As a substitute, I use homes over 4,000 square feet in size.  The vast majority of these homes sell for above $1 Million.  I chose only 4 cities, as they are of similar age and have many similar homes.  The graph shows a growing number of sales.  The average sales price was around $1.8M for the first three months this year, but dropped to around $1.4M in April.  As prices drop, sales increase.    – Wayne Longman

Home Prices – Will History Repeat Itself?

We see a lot of news about home prices, both good and bad.  Nobody can predict the future, but we might find clues about it in the past.  The Case-Shiller Home Price Index, captured the California home price collapse in 1990, as shown in the first chart – for high-tier Los Angeles homes.  Then the prices had increased by about a factor of two, just like our last bubble, as shown in the second chart.  The scale in the first chart has been expanded to show they were very similar bubbles, even to their relative size, shape, duration and the false recoveries in 1991 and 2007.  Maybe we can use the 1990’s experience to project our current recovery. 

If so, the blue bars show that it took seven years from the peak to just get to the point where prices began a true recovery.  Our price recovery may not start until 2013, and this is a worse economic situation than in the 1990’s. In between now and 2013 we may see still lower prices.  It is difficult to tell if the small peak we see today is a false recovery or the reaction to an overshoot in the drop, but from the last bubble it is not likely the beginning of recovery.  Again historically, that increase around 2013 will be at the rate of inflation, which in the long term is around 2.5% a year.  If so, this is relative price stability and isn’t bad news – volatility in home prices is the bad news because neither sellers or buyers know what to expect.  – Wayne Longman

Case-Shiller LA High Tier 1990 Bubble
LA Case-Shiller High Tier 2006 Bubble

Effect of Bank-Owned On Non-Bank-Owned Prices

Bank-owned properties (aka REO’s) are known to affect surrounding property prices.  This effect might be seen in past sale prices in the well-defined Palm Springs community of Vista Las Palmas.  This graph shows a decrease in the long term price trend of Non-REO homes at about the time the REO homes were sold.  The effect isn’t that great because REO’s are generally priced low, but close to the market.  There may even be early signs of price strengthening as they fade into the past.  As always though, prices are determined by Buyers.  – Wayne Longman

VLP

High End Home Prices Continue Decline in Palm Springs Area

High end home sales in the Palm Springs area have taken a big hit.  It’s hard to see trends when sales are combined with low end foreclosures, or when looking at a given price bracket.  If for example you look at homes that sold for over $1,000,000, your numbers are skewed by those homes that once sold there, but now sell for less.

The first graph below attempts to get around this by looking at a constant group of homes in four Valley cities (Palm Springs, Rancho Mirage, Palm Desert and Indian Wells) that are all 4,000 square feet in size or larger.  To get rid of the “noise” of wide variation of sales prices in this range, each point on the graph represents the moving average sales price of the immediately previous 60 sales. In addition to the big average sales price drop, there are many fewer sales per month now than at the peak.

Trends

The second graph showing just the most recent 60 sales, doesn’t show any major change in the overall trend. In this graph the line doesn’t represent a moving average but just the overall trend.  Keep in mind these are what people are buying, and don’t reflect asking prices.  Those wanting to sell though should look at the prices that are selling.

Reecent Trend

I had expected to see a leveling off or even a small average price increase.

Sales Decline In Large Expensive Homes – A Symptom

A significant drop in the number of sales of large homes over $3,000,000 can be attributed to falling sales prices, fewer buyers, or both. There is no doubt prices have fallen at the high-end, so many have dropped out of this niche, but it also shows that high-end sellers should attempt to price below this no-man’s land.

Home Sales Over $3,000,000

Sale prices could drop more in any given development if they haven’t returned to circa-2003 levels that deflate prices back to their non-bubble growth rate. This has happened in several local high-end communities, so there are some good deals around, but not all.

Those holding out for a return to the top, may wait a long time. It took LA ten years to recover from the 1990’s housing decline. Housing appreciates at the inflation rate, around 2.5%, so it could take even longer than that. This applies to all price ranges. If you want to sell, price to market. Most buyers are then confident that they can buy safely.

Palm Springs Area – A Good Time To Buy or Sell

We’ve seen higher- end home prices drop here at a rate of 1.5 to 2% per month, since January 2008.   A 35% or more price reduction from the highs in 2006-2007 is not uncommon.  In the last few months though, prices seem more stable and we may get a modest annual boost from the increased numbers of buyers here for our winter season. 

For individual sales exact trend prices may not matter too much as buyers are willing to pay more for a property they love and less for one they want to upgrade.  Two buyers may easily differ on the value of a home by 10%, which can mask any short-term trend value change.   The amount of inventory can also affect price if the lower priced homes in the same class are bought first – leaving later buyers with fewer choices and higher prices.

So, in a stable or further declining market, there is no reason for Sellers to wait as prices are not expected to rapidly rise if history repeats itself.  It took LA 10 years to recover the high they experienced in 1999 from the housing downturn then

It’s also a good time for Buyers, as we may be seeing the bottom.  Those buyers who believe we can go down another 20% might wait, but that’s a gamble.